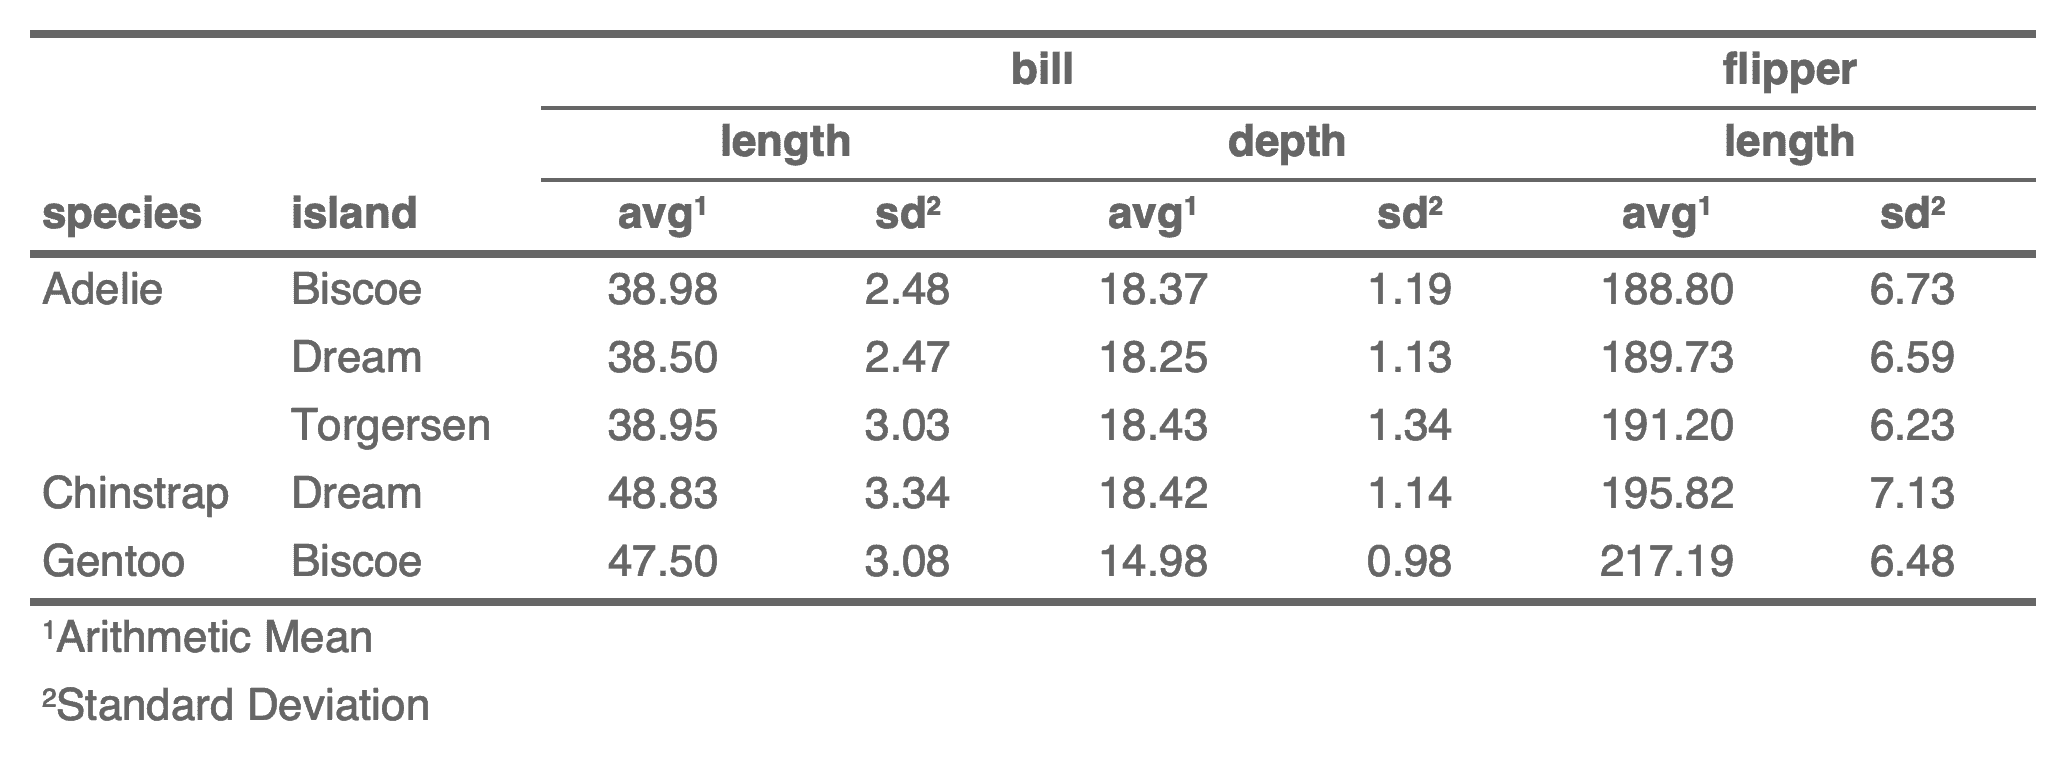
The function adds a list of values to be inserted as new rows in the footer. The values are inserted in existing columns of the input data of the flextable. Rows can be inserted at the top or the bottom of the footer.
If some columns are not provided, they will be replaced by
NA
and displayed as empty.
add_footer(x, top = TRUE, ..., values = NULL)
a flextable object
should the rows be inserted at the top or the bottom.
named arguments (names are data colnames) of values
to add. It is important to insert data of the same type as the
original data, otherwise it will be transformed (probably
into strings if you add a character
where a double
is expected).
This makes possible to still format cell contents with the colformat_*
functions, for example colformat_num()
.
a list of name-value pairs of labels or values,
names should be existing col_key values. This argument can be used
instead of ...
for programming purpose (If values
is
supplied argument ...
is ignored).
Other functions to add rows in a flextable:
add_body_row()
,
add_body()
,
add_footer_lines()
,
add_footer_row()
,
add_header_row()
,
add_header()
,
separate_header()
,
set_header_footer_df
,
set_header_labels()
new_row <- as.list(colMeans(iris[, -5]))
new_row$Species <- "Means"
formatter <- function(x) sprintf("%.1f", x)
ft <- flextable(data = head(iris))
ft <- add_footer(ft, values = new_row)
# cosmetics
ft <- compose(
x = ft, j = 1:4,
value = as_paragraph(
as_chunk(., formatter = formatter)
),
part = "footer", use_dot = TRUE
)
ft <- align(ft, part = "footer", align = "right", j = 1:4)
ft
Run the code above in your browser using DataLab