grand_summary_rows: Add grand summary rows using aggregation functions
Description
Add grand summary rows to the gt table by using applying aggregation
functions to the table data. The summary rows incorporate all of the
available data, regardless of whether some of the data are part of row
groups. You choose how to format the values in the resulting summary cells by
use of a formatter function (e.g, fmt_number) and any relevant options.
Usage
grand_summary_rows(
  data,
  columns = everything(),
  fns,
  missing_text = "---",
  formatter = fmt_number,
  ...
)
Value
An object of class gt_tbl.
Arguments
- data
A table object that is created using the
gt()function.- columns
The columns for which the summaries should be calculated.
- fns
Functions used for aggregations. This can include base functions like
mean,min,max,median,sd, orsumor any other user-defined aggregation function. The function(s) should be supplied within alist(). Within that list, we can specify the functions by use of function names in quotes (e.g.,"sum"), as bare functions (e.g.,sum), or as one-sided R formulas using a leading~. In the formula representation, a.serves as the data to be summarized (e.g.,sum(., na.rm = TRUE)). The use of named arguments is recommended as the names will serve as summary row labels for the corresponding summary rows data (the labels can derived from the function names but only when not providing bare function names).- missing_text
The text to be used in place of
NAvalues in summary cells with no data outputs.- formatter
A formatter function name. These can be any of the
fmt_*()functions available in the package (e.g.,fmt_number(),fmt_percent(), etc.), or a custom function usingfmt(). The default function isfmt_number()and its options can be accessed through....- ...
Values passed to the
formatterfunction, where the provided values are to be in the form of named vectors. For example, when using the defaultformatterfunction,fmt_number(), options such asdecimals,use_seps, andlocalecan be used.
Examples
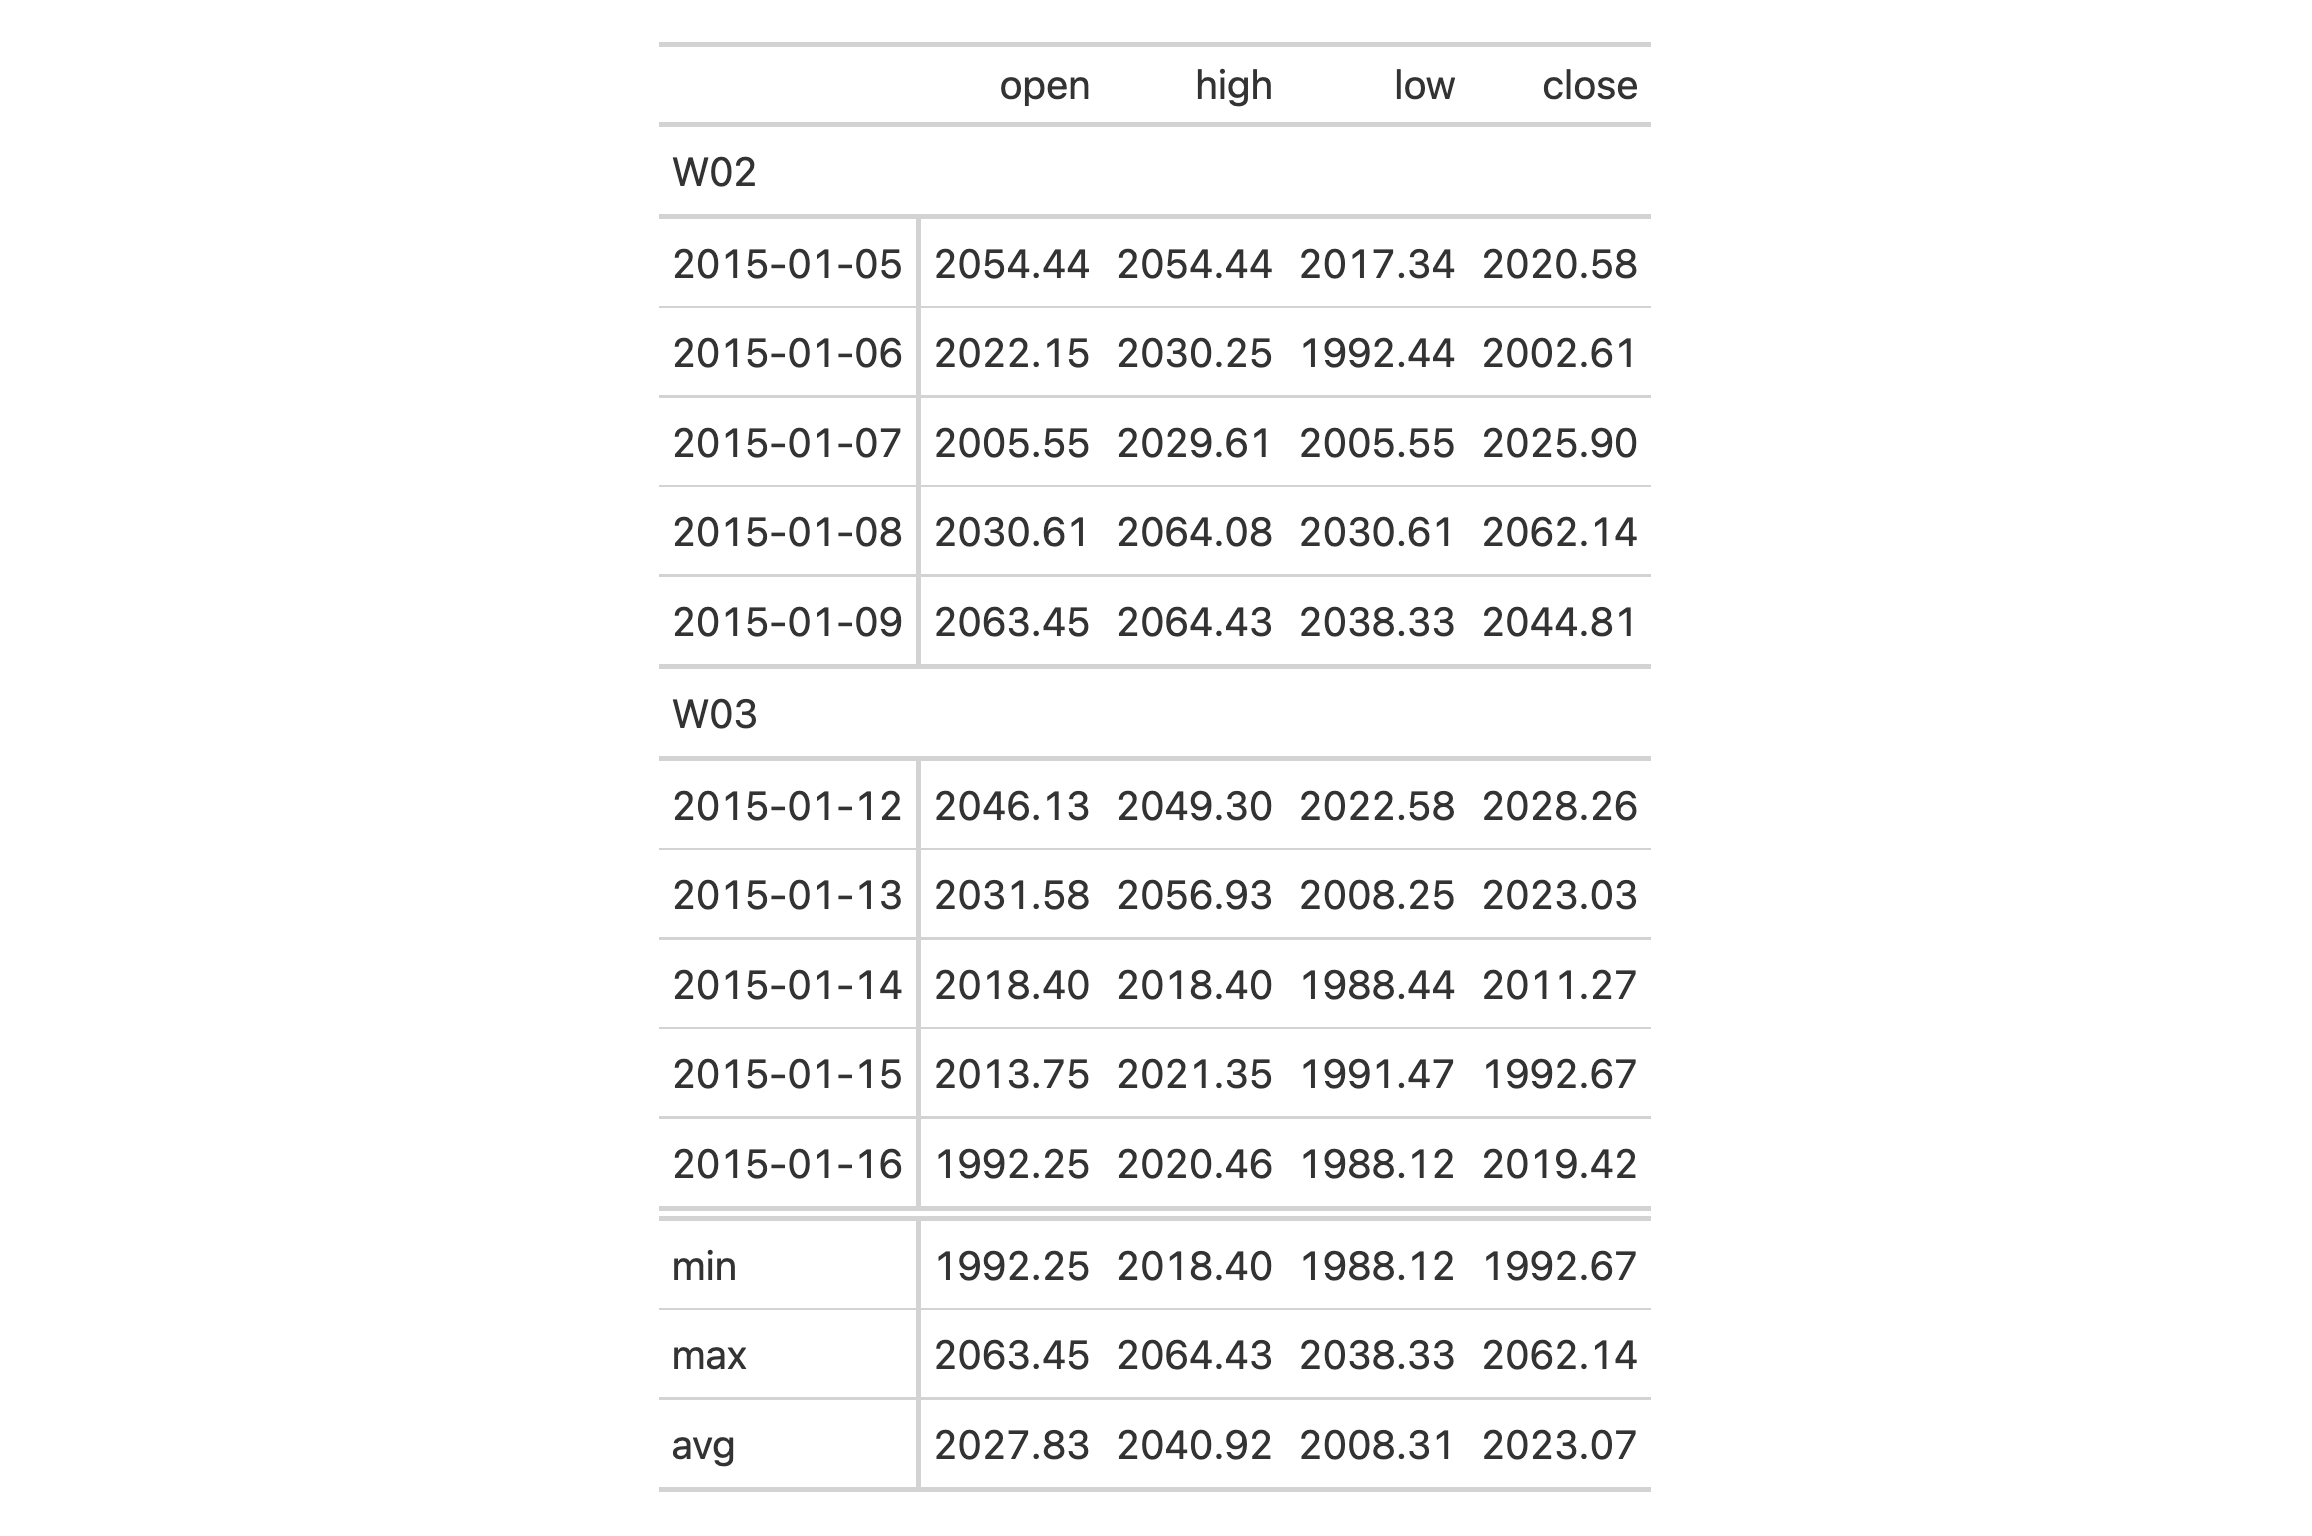
Use sp500 to create a gt table with row groups. Create the grand
summary rows min, max, and avg for the table with the
grand_summary_rows() function.
sp500 %>%
  dplyr::filter(date >= "2015-01-05" & date <= "2015-01-16") %>%
  dplyr::arrange(date) %>%
  dplyr::mutate(week = paste0("W", strftime(date, format = "%V"))) %>%
  dplyr::select(-adj_close, -volume) %>%
  gt(
    rowname_col = "date",
    groupname_col = "week"
  ) %>%
  grand_summary_rows(
    columns = c(open, high, low, close),
    fns = list(
      min = ~min(.),
      max = ~max(.),
      avg = ~mean(.)),
    formatter = fmt_number,
    use_seps = FALSE
  )
Function ID
6-2
Details
Should we need to obtain the summary data for external purposes, the
extract_summary() function can be used with a gt_tbl object where grand
summary rows were added via grand_summary_rows().
See Also
Other Add Rows:
summary_rows()