tab_style: Add custom styles to one or more cells
Description
With the tab_style() function we can target specific cells and apply styles
to them. This is best done in conjunction with the helper functions
cell_text(), cell_fill(), and cell_borders(). At present this function
is focused on the application of styles for HTML output only (as such, other
output formats will ignore all tab_style() calls). Using the aforementioned
helper functions, here are some of the styles we can apply:
the background color of the cell (
cell_fill():color)the cell's text color, font, and size (
cell_text():color,font,size)the text style (
cell_text():style), enabling the use of italics or oblique text.the text weight (
cell_text():weight), allowing the use of thin to bold text (the degree of choice is greater with variable fonts)the alignment and indentation of text (
cell_text():alignandindent)the cell borders (
cell_borders())
Usage
tab_style(data, style, locations)Value
An object of class gt_tbl.
Arguments
- data
A table object that is created using the
gt()function.- style
a vector of styles to use. The
cell_text(),cell_fill(), andcell_borders()helper functions can be used here to more easily generate valid styles. If using more than one helper function to define styles, all calls must be enclosed in alist(). Custom CSS declarations can be used for HTML output by including acss()-based statement as a list item.- locations
the cell or set of cells to be associated with the style. Supplying any of the
cells_*()helper functions is a useful way to target the location cells that are associated with the styling. These helper functions are:cells_title(),cells_stubhead(),cells_column_spanners(),cells_column_labels(),cells_row_groups(),cells_stub(),cells_body(),cells_summary(),cells_grand_summary(),cells_stub_summary(),cells_stub_grand_summary(),cells_footnotes(), andcells_source_notes(). Additionally, we can enclose severalcells_*()calls within alist()if we wish to apply styling to different types of locations (e.g., body cells, row group labels, the table title, etc.).
Examples
Use exibble to create a gt table. Add styles that are to be applied
to data cells that satisfy a condition (using tab_style()).
exibble %>%
  dplyr::select(num, currency) %>%
  gt() %>%
  fmt_number(
    columns = c(num, currency),
    decimals = 1
  ) %>%
  tab_style(
    style = list(
      cell_fill(color = "lightcyan"),
      cell_text(weight = "bold")
      ),
    locations = cells_body(
      columns = num,
      rows = num >= 5000
    )
  ) %>%
  tab_style(
    style = list(
      cell_fill(color = "#F9E3D6"),
      cell_text(style = "italic")
      ),
    locations = cells_body(
      columns = currency,
      rows = currency < 100
    )
  )

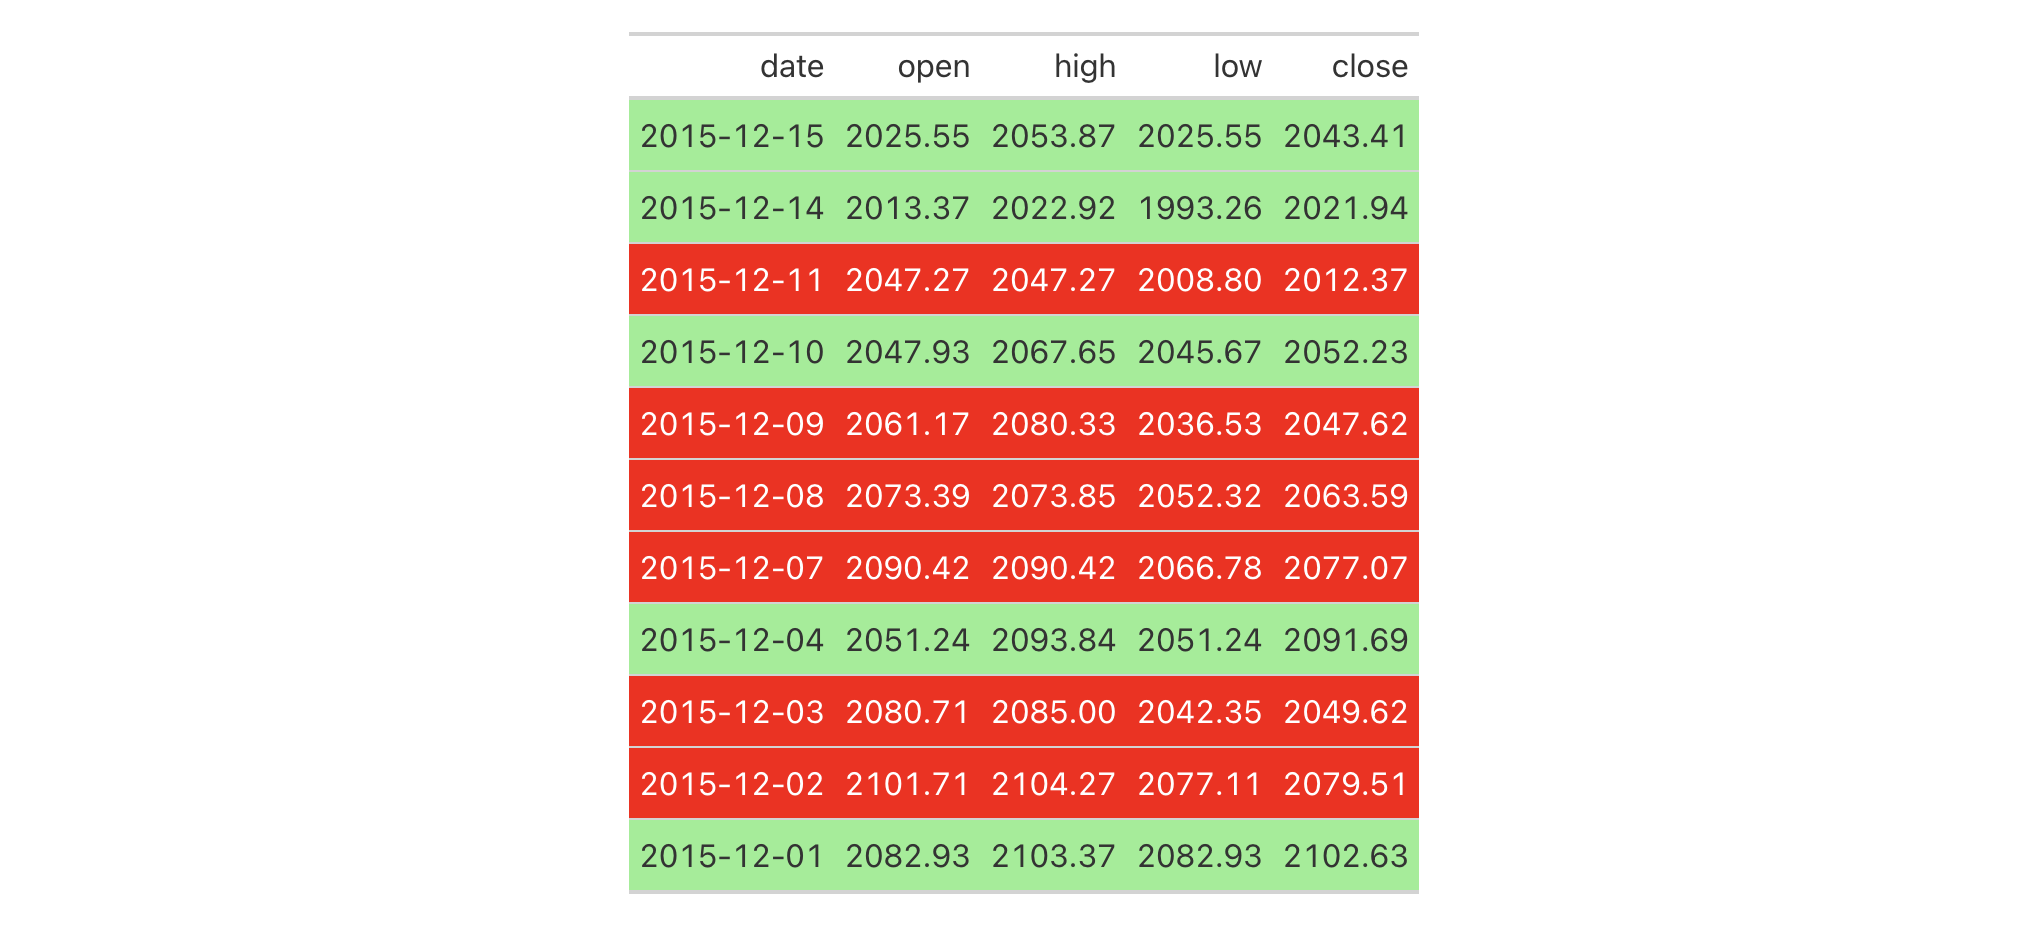
Use sp500 to create a gt table. Color entire rows of cells based on
values in a particular column.
sp500 %>%
  dplyr::filter(
    date >= "2015-12-01" &
    date <= "2015-12-15"
  ) %>%
  dplyr::select(-c(adj_close, volume)) %>%
  gt() %>%
  tab_style(
    style = cell_fill(color = "lightgreen"),
    locations = cells_body(rows = close > open)
  ) %>%
  tab_style(
    style = list(
      cell_fill(color = "red"),
      cell_text(color = "white")
      ),
    locations = cells_body(rows = open > close)
  )
Use exibble to create a gt table. Replace missing values with the
sub_missing() function and then add styling to the char column with
cell_fill() and with a CSS style declaration.
exibble %>%
  dplyr::select(char, fctr) %>%
  gt() %>%
  sub_missing() %>%
  tab_style(
    style = list(
      cell_fill(color = "lightcyan"),
      "font-variant: small-caps;"
    ),
    locations = cells_body(columns = char)
  )

Function ID
2-8
See Also
cell_text(), cell_fill(), and cell_borders() as helpers for
defining custom styles and cells_body() as one of many useful helper
functions for targeting the locations to be styled.
Other Create or Modify Parts:
tab_footnote(),
tab_header(),
tab_options(),
tab_row_group(),
tab_source_note(),
tab_spanner_delim(),
tab_spanner(),
tab_stubhead()