tab_footnote: Add a table footnote
Description
The tab_footnote() function can make it a painless process to add a
footnote to a gt table. There are two components to a footnote: (1) a
footnote mark that is attached to the targeted cell text, and (2) the
footnote text (that starts with the corresponding footnote mark) that is
placed in the table's footer area. Each call of tab_footnote() will add a
different note, and one or more cells can be targeted via the location helper
functions (e.g., cells_body(), cells_column_labels(), etc.).
Usage
tab_footnote(
  data,
  footnote,
  locations = NULL,
  placement = c("auto", "right", "left")
)
Value
An object of class gt_tbl.
Arguments
- data
A table object that is created using the
gt()function.- footnote
The text to be used in the footnote. We can optionally use the
md()andhtml()functions to style the text as Markdown or to retain HTML elements in the footnote text.- locations
The cell or set of cells to be associated with the footnote. Supplying any of the
cells_*()helper functions is a useful way to target the location cells that are associated with the footnote text. These helper functions are:cells_title(),cells_stubhead(),cells_column_spanners(),cells_column_labels(),cells_row_groups(),cells_stub(),cells_body(),cells_summary(),cells_grand_summary(),cells_stub_summary(), andcells_stub_grand_summary(). Additionally, we can enclose severalcells_*()calls within alist()if we wish to link the footnote text to different types of locations (e.g., body cells, row group labels, the table title, etc.).- placement
Where to affix footnote marks to the table content. Two options for this are
"leftor"right", where the placement is to the absolute left or right of the cell content. By default, however, this is set to"auto"whereby gt will choose a preferred left-or-right placement depending on the alignment of the cell content.
Examples
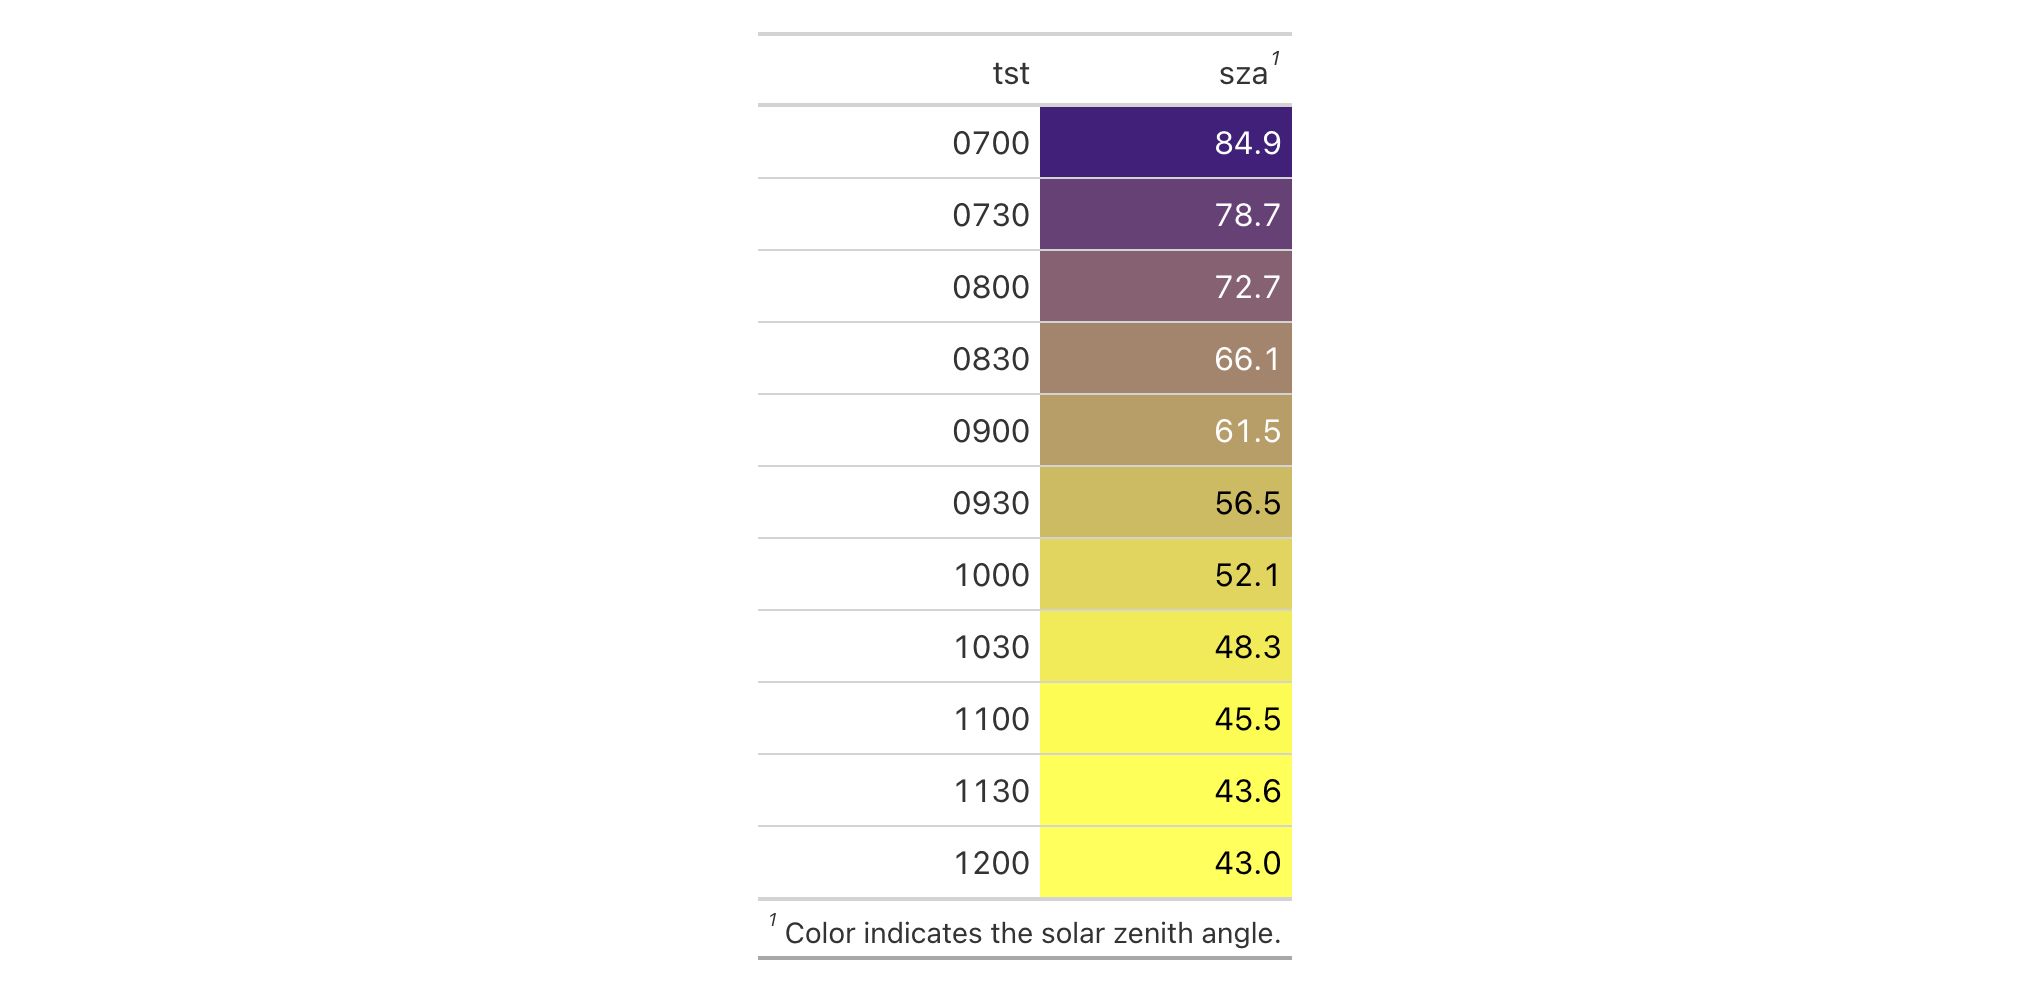
Use sza to create a gt table. Color the sza column using the
data_color() function, then, use tab_footnote() to add a footnote to the
sza column label (explaining what the color scale signifies).
sza %>%
  dplyr::filter(
    latitude == 20 &
      month == "jan" &
      !is.na(sza)
  ) %>%
  dplyr::select(-latitude, -month) %>%
  gt() %>%
  data_color(
    columns = sza,
    colors = scales::col_numeric(
      palette = c("white", "yellow", "navyblue"),
      domain = c(0, 90)
    )
  ) %>%
  tab_footnote(
    footnote = "Color indicates height of sun.",
    locations = cells_column_labels(
      columns = sza
    )
  )
Function ID
2-7
Details
The formatting of the footnotes can be controlled through the use of various
parameters in the tab_options() function:
footnotes.multiline: a setting that determines whether footnotes each start on a new line or are combined into a single block.footnotes.sep: allows for a choice of the separator between consecutive footnotes in the table footer. By default, this is set to a single space character.footnotes.marks: the set of sequential characters or numbers used to identify the footnotes.footnotes.font.size: the size of the font used in the footnote section.footnotes.padding: the amount of padding to apply between the footnote and source note sections in the table footer.
See Also
Other part creation/modification functions:
tab_caption(),
tab_header(),
tab_info(),
tab_options(),
tab_row_group(),
tab_source_note(),
tab_spanner_delim(),
tab_spanner(),
tab_stub_indent(),
tab_stubhead(),
tab_style_body(),
tab_style()