Last chance! 50% off unlimited learning
Sale ends in
lifecycle::badge("experimental")
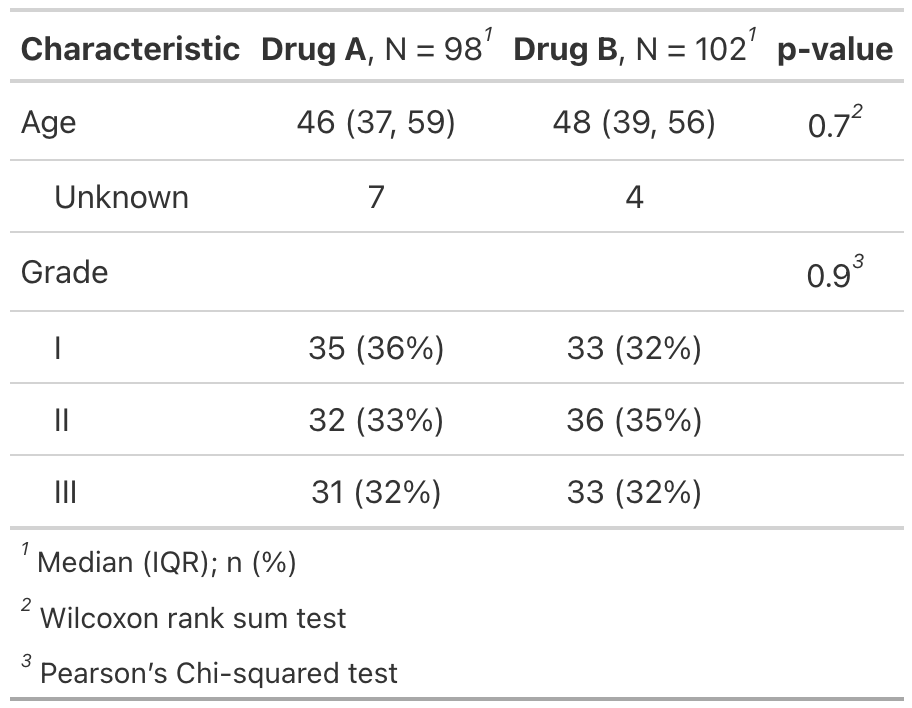
The usual presentation of footnotes for p-values on a gtsummary table is
to have a single footnote that lists all statistical tests that were used to
compute p-values on a given table. The separate_p_footnotes()
function
separates aggregated p-value footnotes to individual footnotes that denote
the specific test used for each of the p-values.
separate_p_footnotes(x)
object with class "tbl_summary"
or "tbl_svysummary"
Example 1
Review list, formula, and selector syntax used throughout gtsummary
Other tbl_summary tools:
add_ci()
,
add_n.tbl_summary()
,
add_overall()
,
add_p.tbl_summary()
,
add_q()
,
add_stat_label()
,
bold_italicize_labels_levels
,
inline_text.tbl_summary()
,
inline_text.tbl_survfit()
,
modify
,
tbl_custom_summary()
,
tbl_merge()
,
tbl_split()
,
tbl_stack()
,
tbl_strata()
,
tbl_summary()
Other tbl_svysummary tools:
add_n.tbl_summary()
,
add_overall()
,
add_p.tbl_svysummary()
,
add_q()
,
add_stat_label()
,
modify
,
tbl_merge()
,
tbl_split()
,
tbl_stack()
,
tbl_strata()
,
tbl_svysummary()
# Example 1 ----------------------------------
separate_p_footnotes_ex1 <-
trial %>%
select(trt, age, grade) %>%
tbl_summary(by = trt) %>%
add_p() %>%
separate_p_footnotes()
Run the code above in your browser using DataLab